The housing market boom in Hungary, mapped
Kövesse az Indexet Facebookon is!
Követem!
You don't need to be a real estate expert to see that in recent times, the Hungarian housing market was in a perpetual gold-rush - in the past couple of years, prices produced double-digit growth. But much of the current data shows that this trend could be coming to an end, and real estate values will keep slowly climbing instead of the unprecedented explosion that had been going on since 2015.
We are going to visually demonstrate this process using data from the Hungarian Central Statistical Office's real estate database that compiles information about sales of second-hand homes based on the actual sales figures rather than advertised prices.
Most complaints about out-of-hand property prices concern Budapest, but life did not stop in larger towns outside the capital either. The foreign-currency loan boom during the first half of the 2000s already created a similar increase in prices as the current wave, however, in 2006, the average price per square metre of homes in larger cities in the countryside still remained under 200 000 Forints (~€600 at current rates).
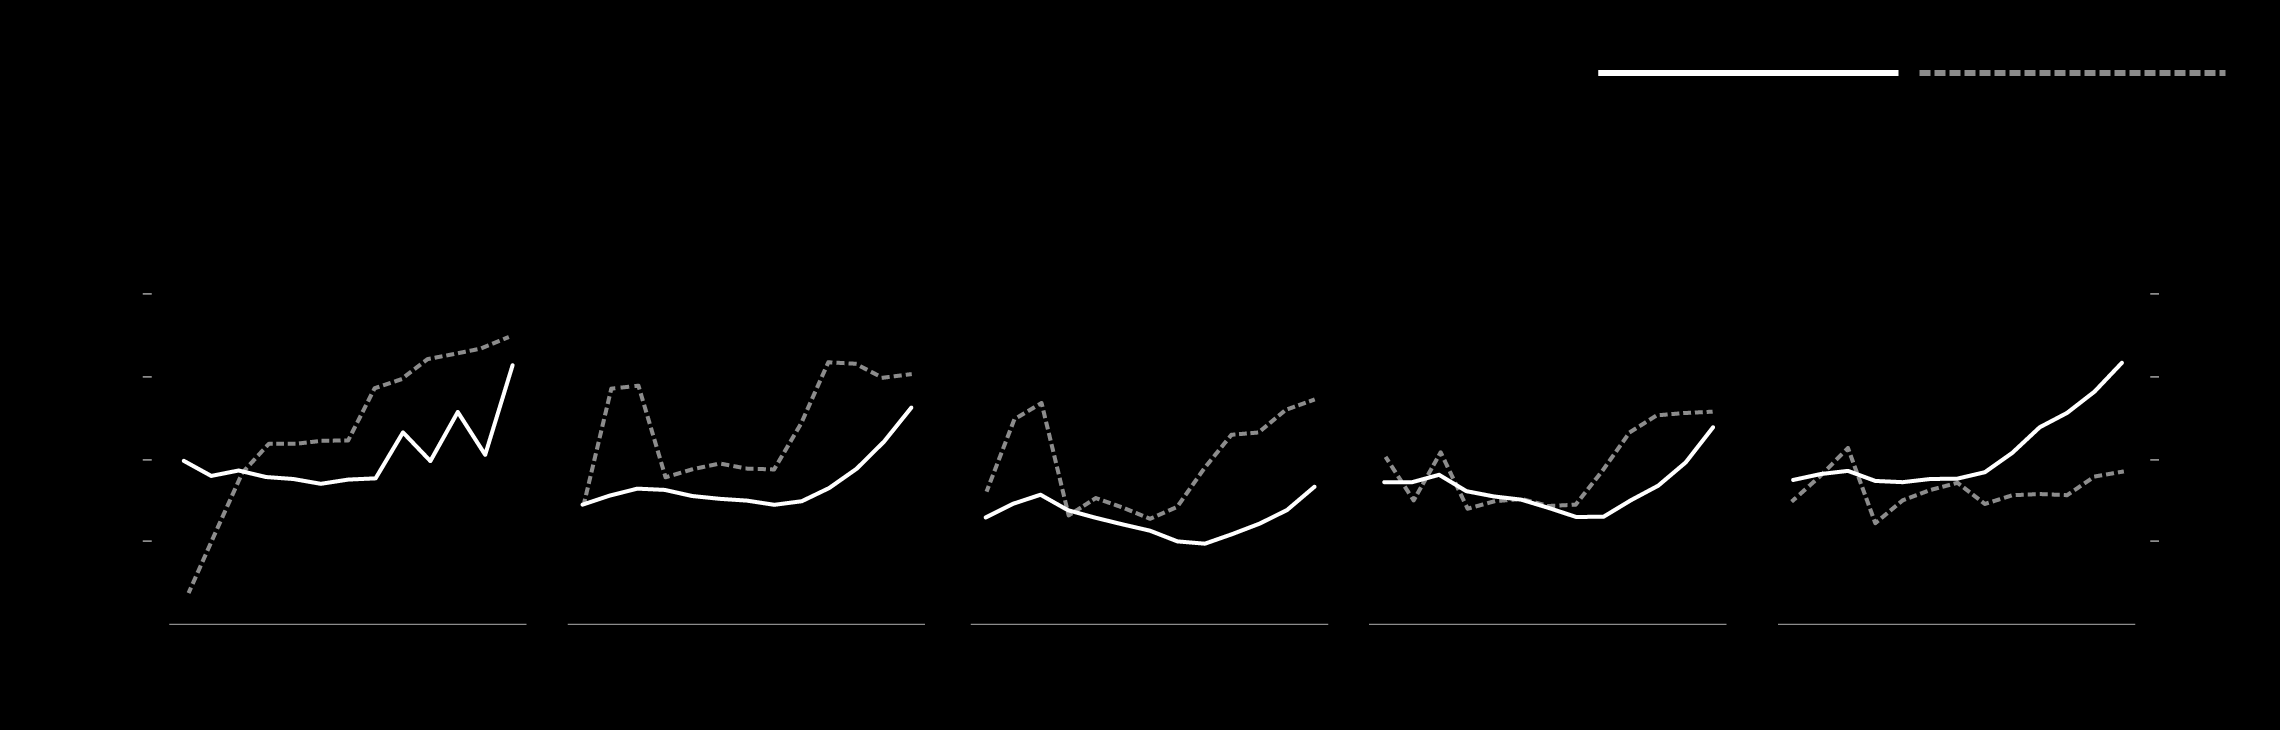
Housing market in big cities
av cost per sq m
properties sold
Győr
Debrecen
Szeged
Miskolc
Pécs
400 000 Ft
4000 pcs
3000
300 000
200 000
2000
1000
100 000
2006
2014
2018
2006
2006
2014
2014
2018
2018
2006
2014
2018
2006
2014
2018
2006
2014
2018
2010
2010
2010
2010
2010
2010
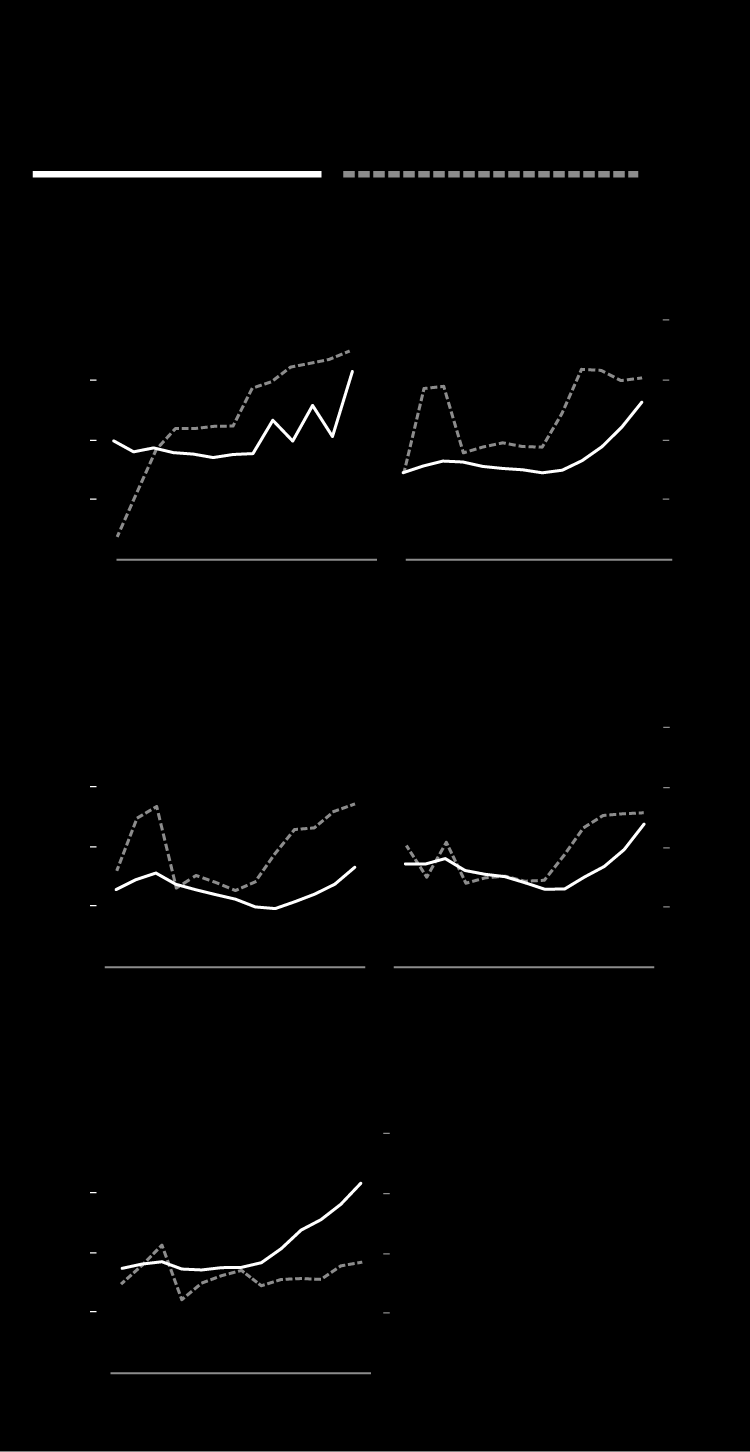
Prices and sales figures in big cities
average cost per sq. meter
properties sold
Szeged
Debrecen
400 e Ft
4000pcs
3000
300 e
200 e
2000
1000
100 e
2006
2014
2018
2006
2006
2014
2014
2018
2018
2010
2010
2010
Miskolc
Pécs
400 e Ft
4000pcs
300 e
3000
200 e
2000
100 e
1000
2006
2014
2018
2006
2014
2018
2010
2010
Győr
400 e Ft
4000 pcs
300 e
3000
200 e
2000
100 e
1000
2006
2014
2018
2010
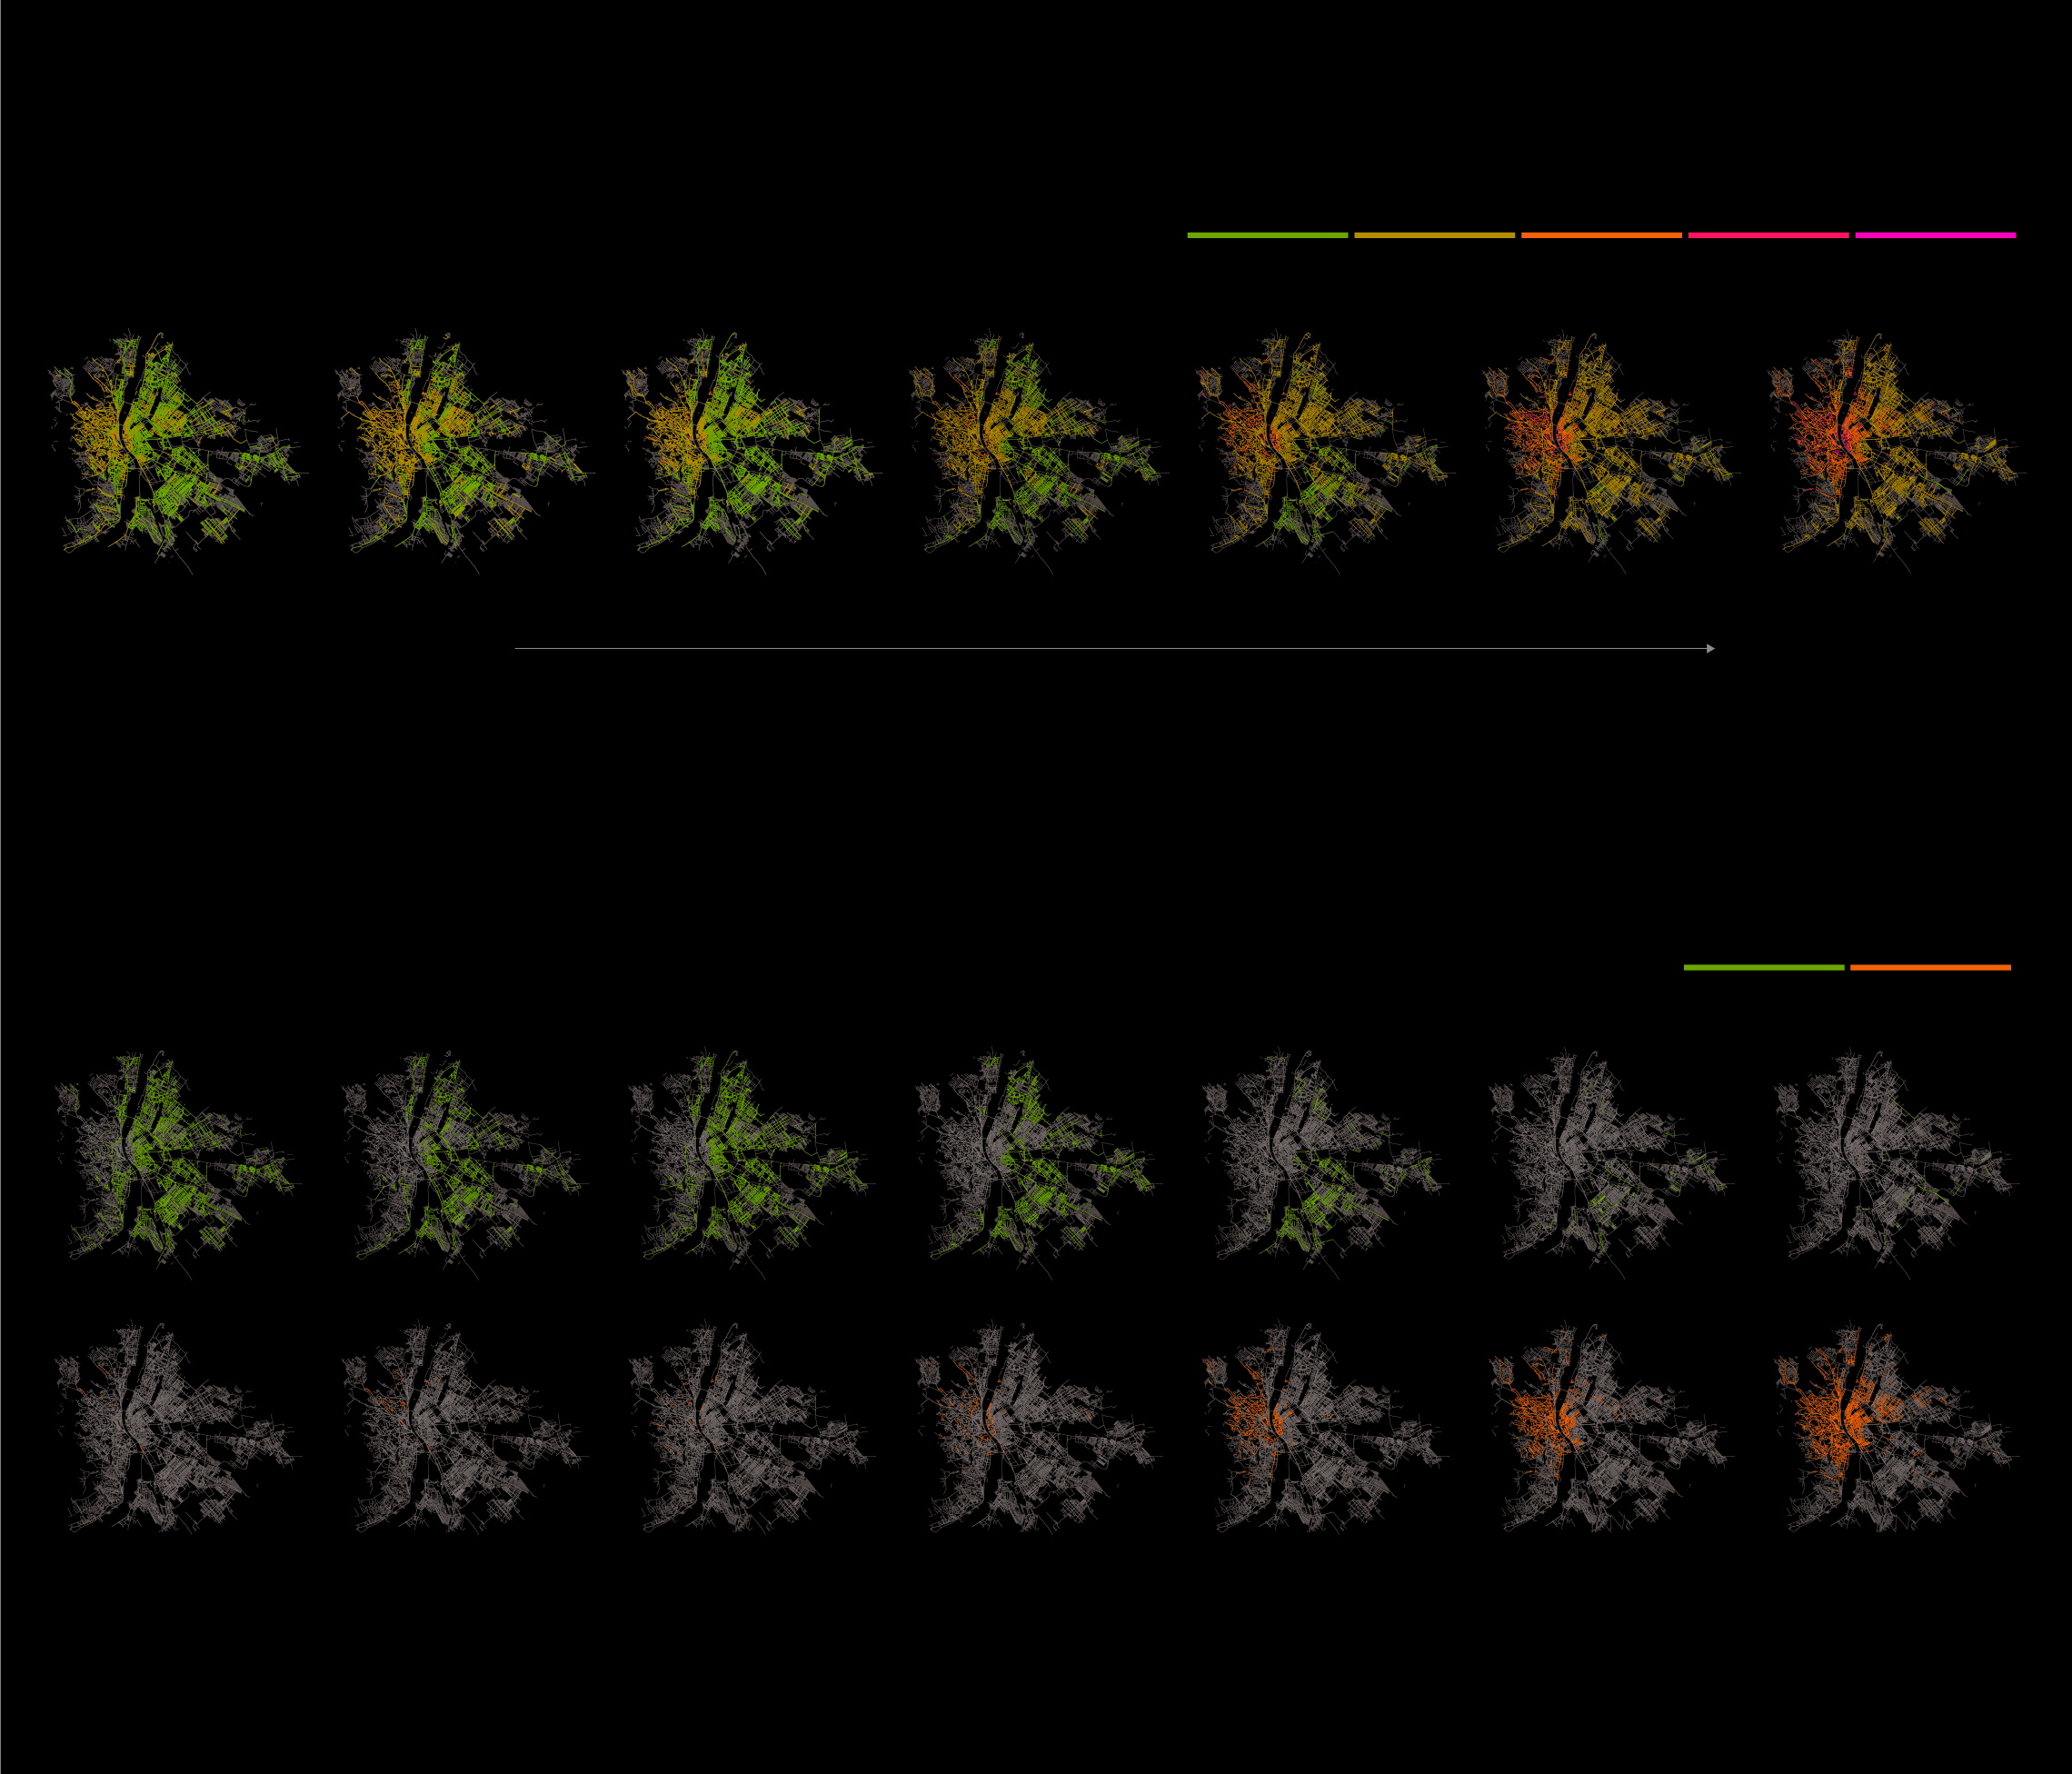
But the latest boom quickly drove prices way past their 2006 levels: The comparative maps below show many streets turning yellow over a ten-year period, indicating that more and more streets have entered the price category of 300 000 - 400 000 Forints per square metre (€900-€1200). On the 2018 maps, there are hardly any green streets left, the only exception is Miskolc. The city situated in the north-eastern part of Hungary remained surprisingly cheap compared to other cities of similar sizes that similarly have universities, prices seemed to go up only in a few suburban streets close to the downtown area. Debrecen, on the other hand, saw a price hike only comparable to Budapest, the cost of homes there almost doubled in 12 years.
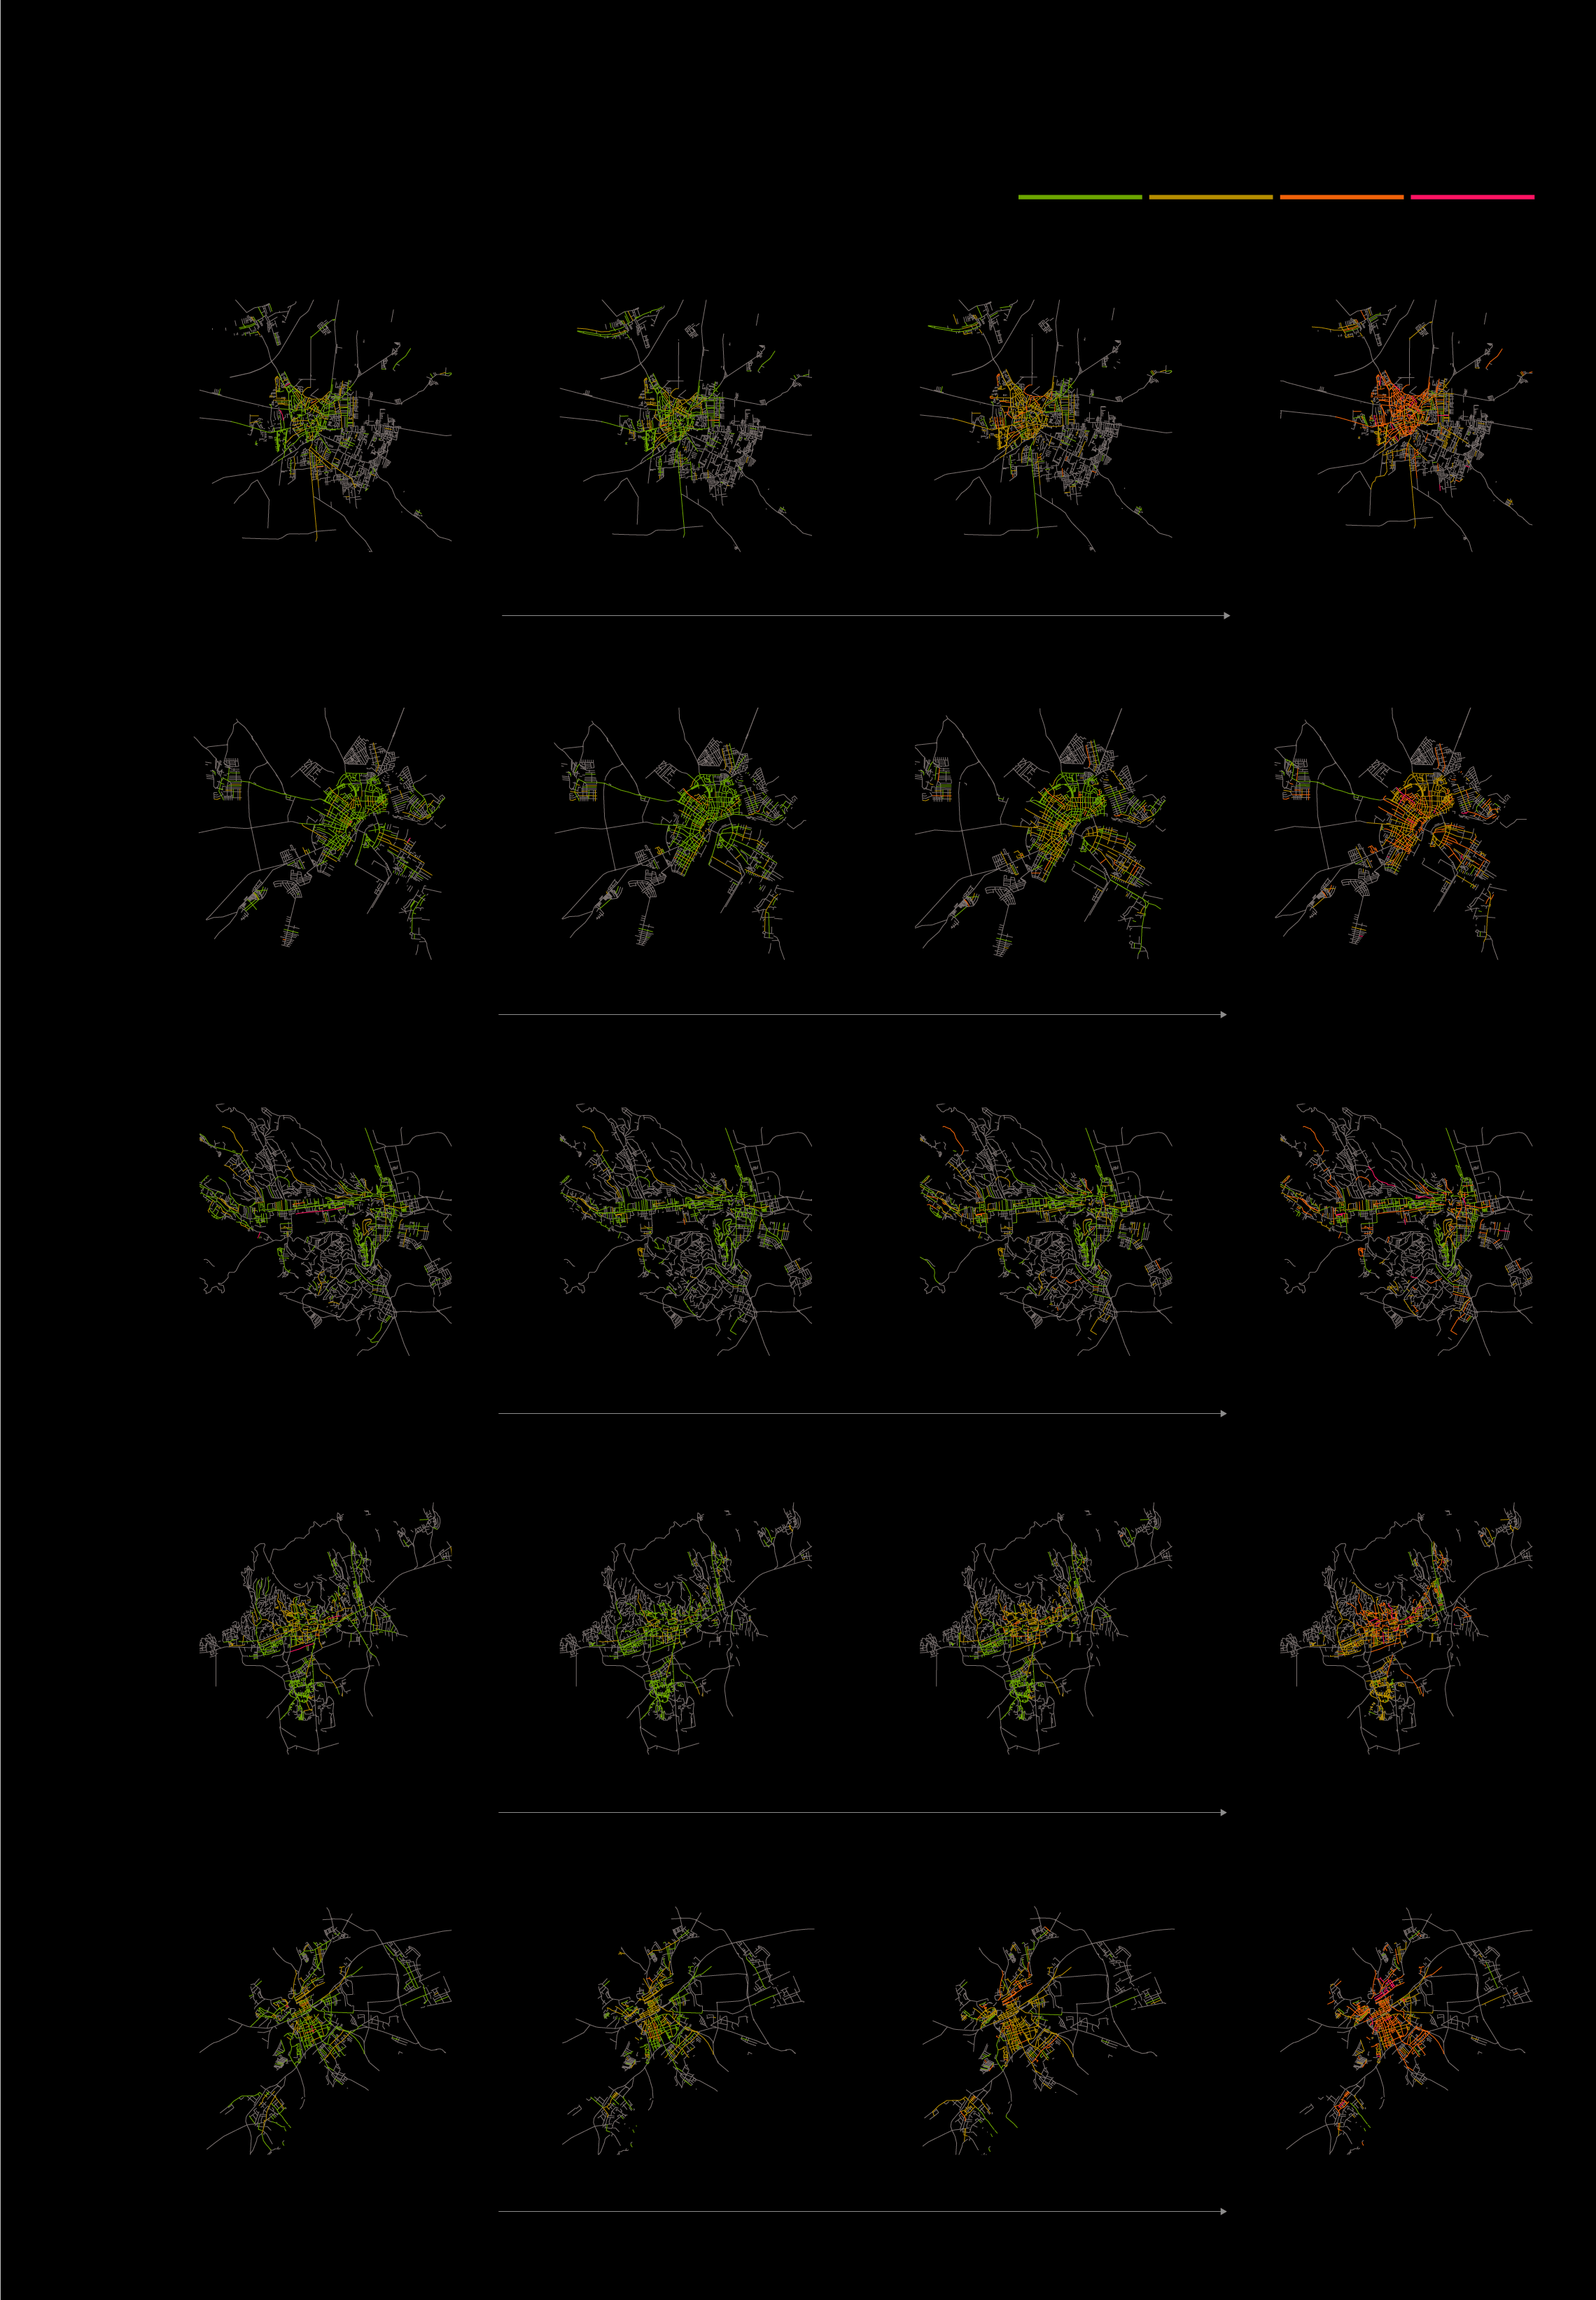
Cost per square meter in big cities
Debrecen and Győr has had the greatest price hike while Miskolc remained affordable
under 20K
200 - 300K
300 - 400K
above 400K
forint
2016
2014
2006
2018
Debrecen
315K
cost per square meter: 181K forint
Szeged
146K
264K
Miskolc
168K
130K
Pécs
173K
240K
Győr
176K
318K
source: KSH ingatlanadattár
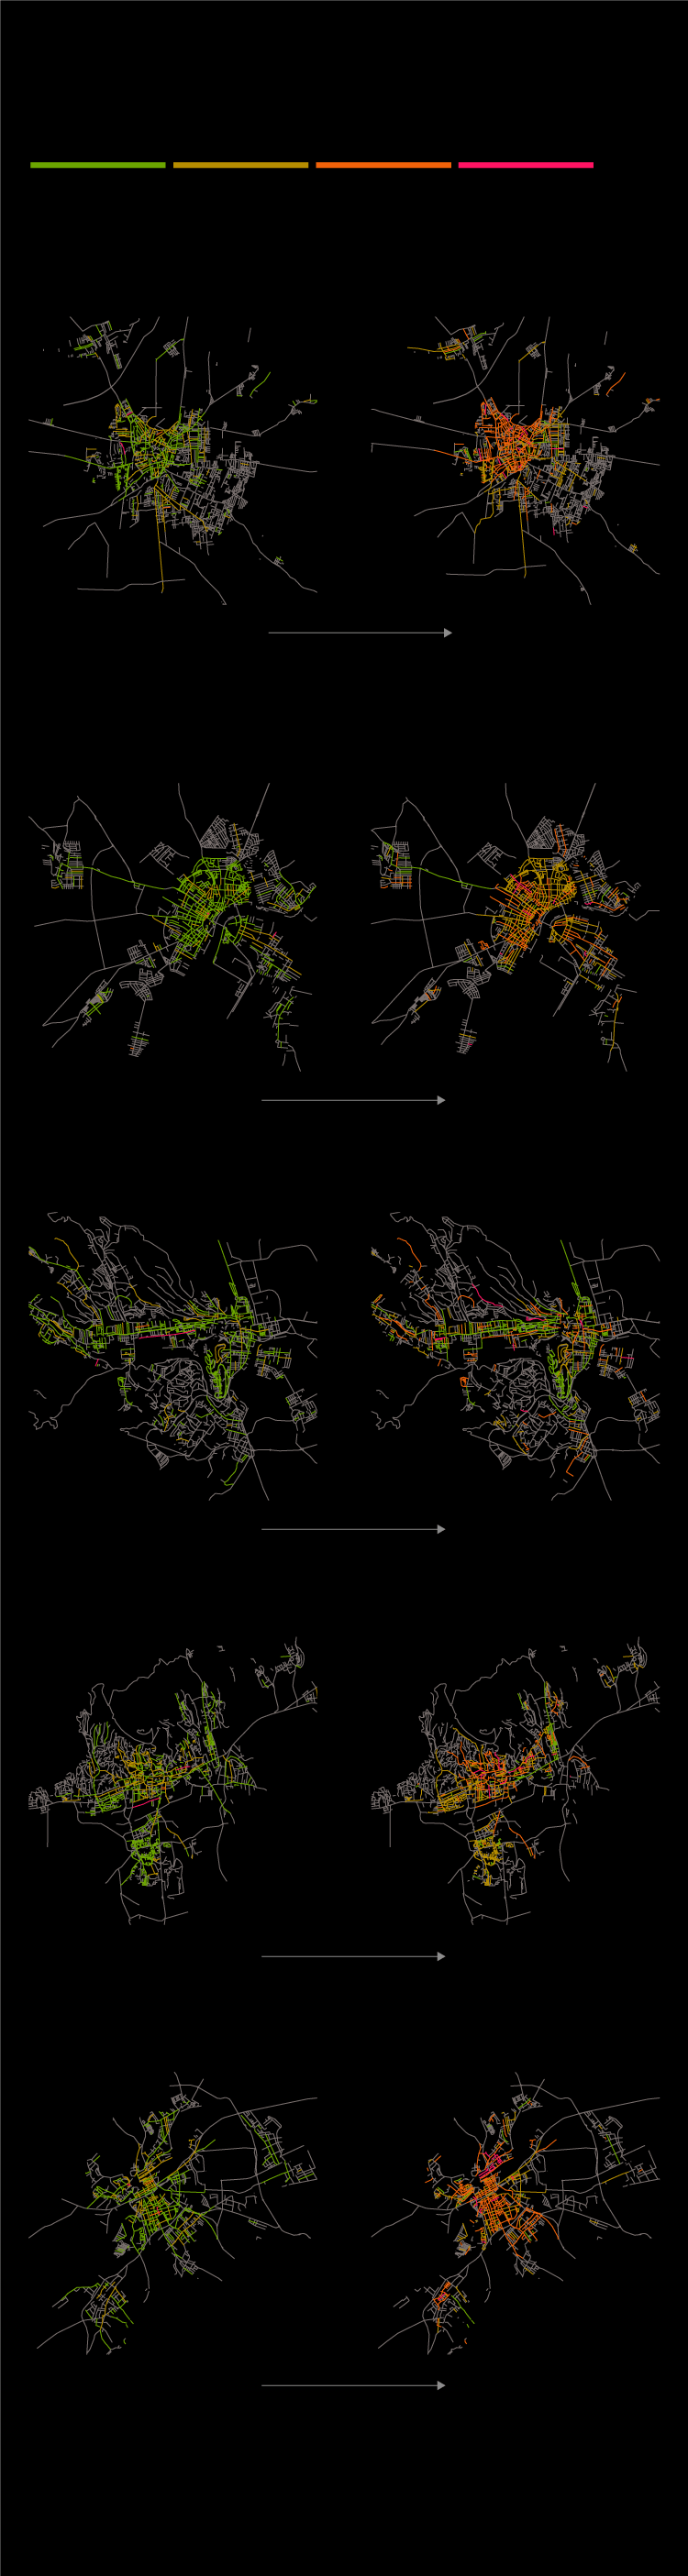
Cost per square meter in big cities
under 200K
200 - 300K
300 - 400K
above 400K
forint
2006
2018
Debrecen
181K forint
315K
cost per square meter:
Szeged
146K
264K
Miskolc
130K
168K
Pécs
173K
240K
Győr
318K
176K
source: KSH ingatlanadattár
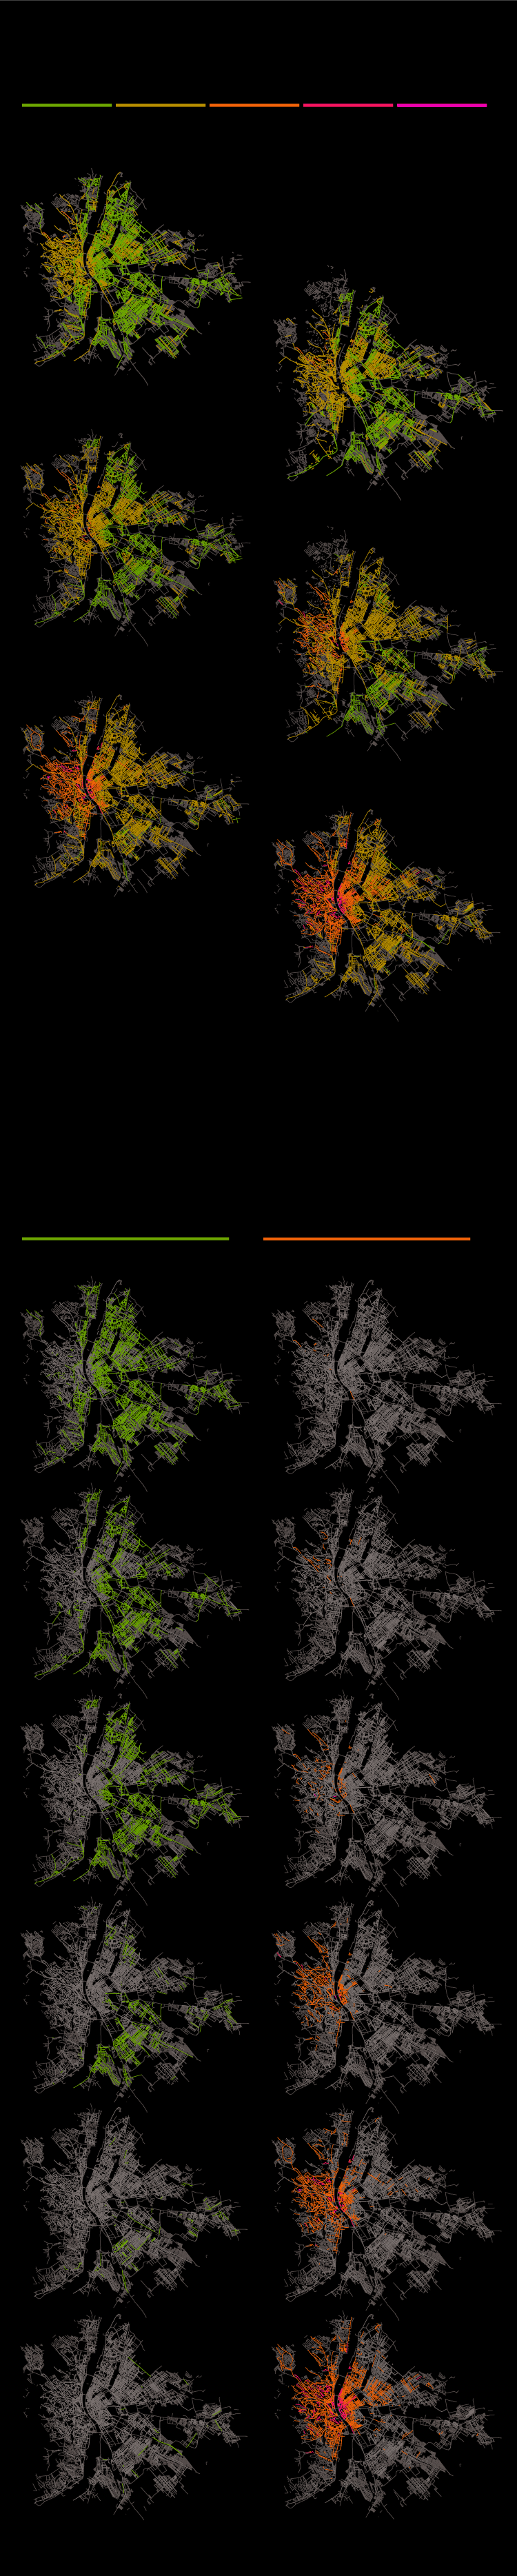
Of course, this process was even more dramatic in Budapest; Cheap properties have all but disappeared in the capital during the past decade, along with the opportunity for self-owned homes for many individuals. In 2006, the average price per square meter was below the 250 000 Forint mark in most of Budapest, but by 2018, those low prices became extremely rare, and all of downtown Budapest skyrocketed to the 500 000 - 1 000 000 Forint (~€1500-€3000) category. But there are more and more homes going for even higher prices, most of which are in the V. district, and based on the average prices, the most expensive address in Hungary is also there - Dorottya street, situated between Vörösmarty and Széchenyi squares.
Skyrocketing property prices in Budapest
Since 2006 the average cost per square meter has more then doubled
under 250K
250K - 500K
500 - 750K
750K - 1M
over 1M
forint*
2014
2016
2006
2015
2010
2018
2017
Average square meter cost: 242K
512K
Cheap housing options are vanishing as luxury neighborhoods are multiplying
over 500K
under 250K
*1000 EUR ~ 330K forint
Average cost per square meter by streets based on sale. source: KSH ingatlanadattár
Skyrocketing property prices in Budapest
250 - 500K
750K - 1M
under 250K
500 - 750K
over 1M
2006
2010
2015
2016
2017
2018
The average cost per
square meter in 2006
was 242K forint, which
has more than doubled
to 512K by 2018.
Cheap housing options are vanishing as
luxury neighborhoods are multiplying
under 250K
over 500K
2006
2010
2015
2016
2017
2018
source: KSH ingatlanadattár
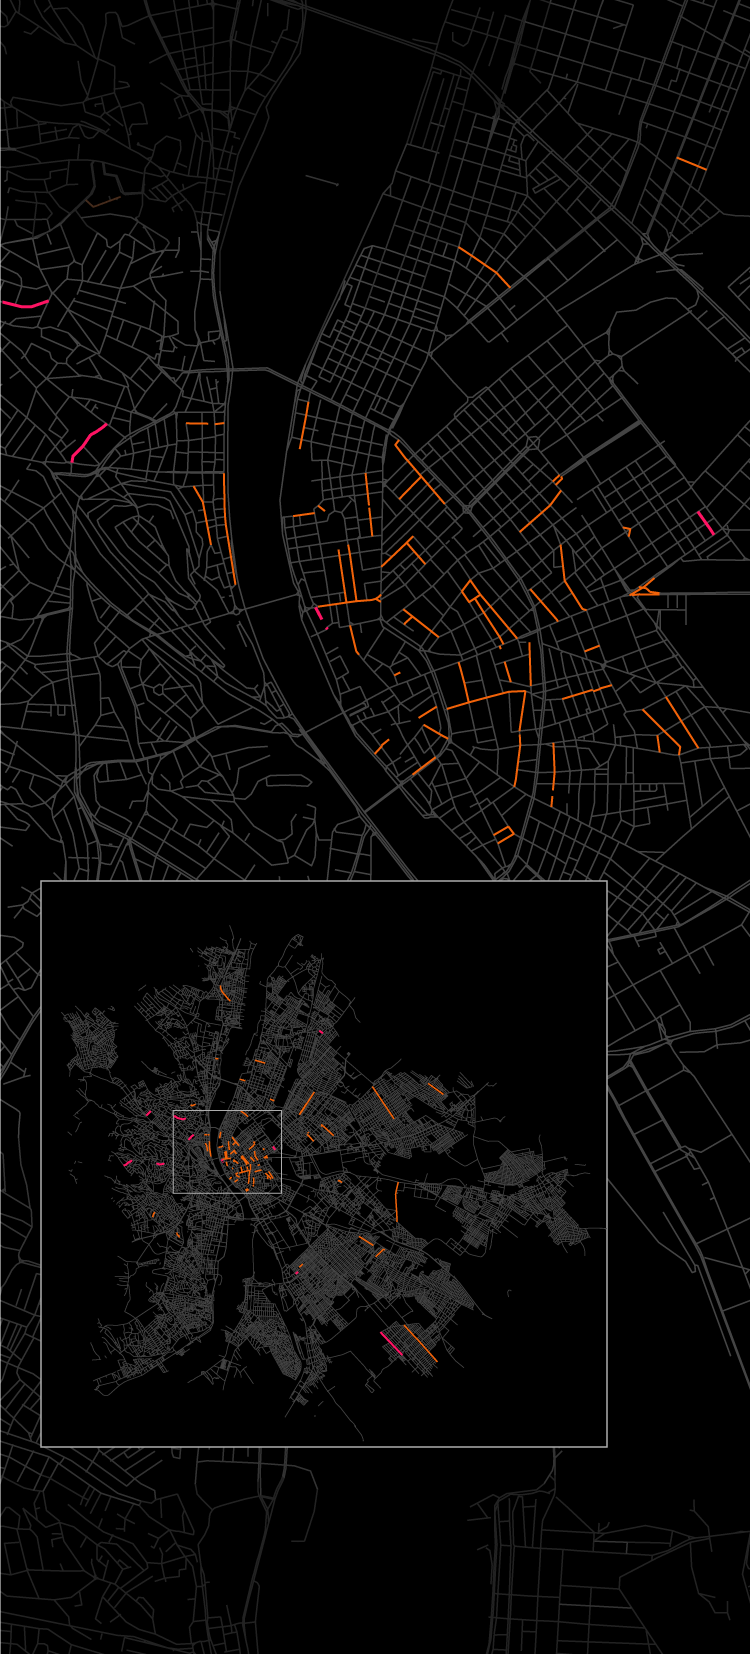
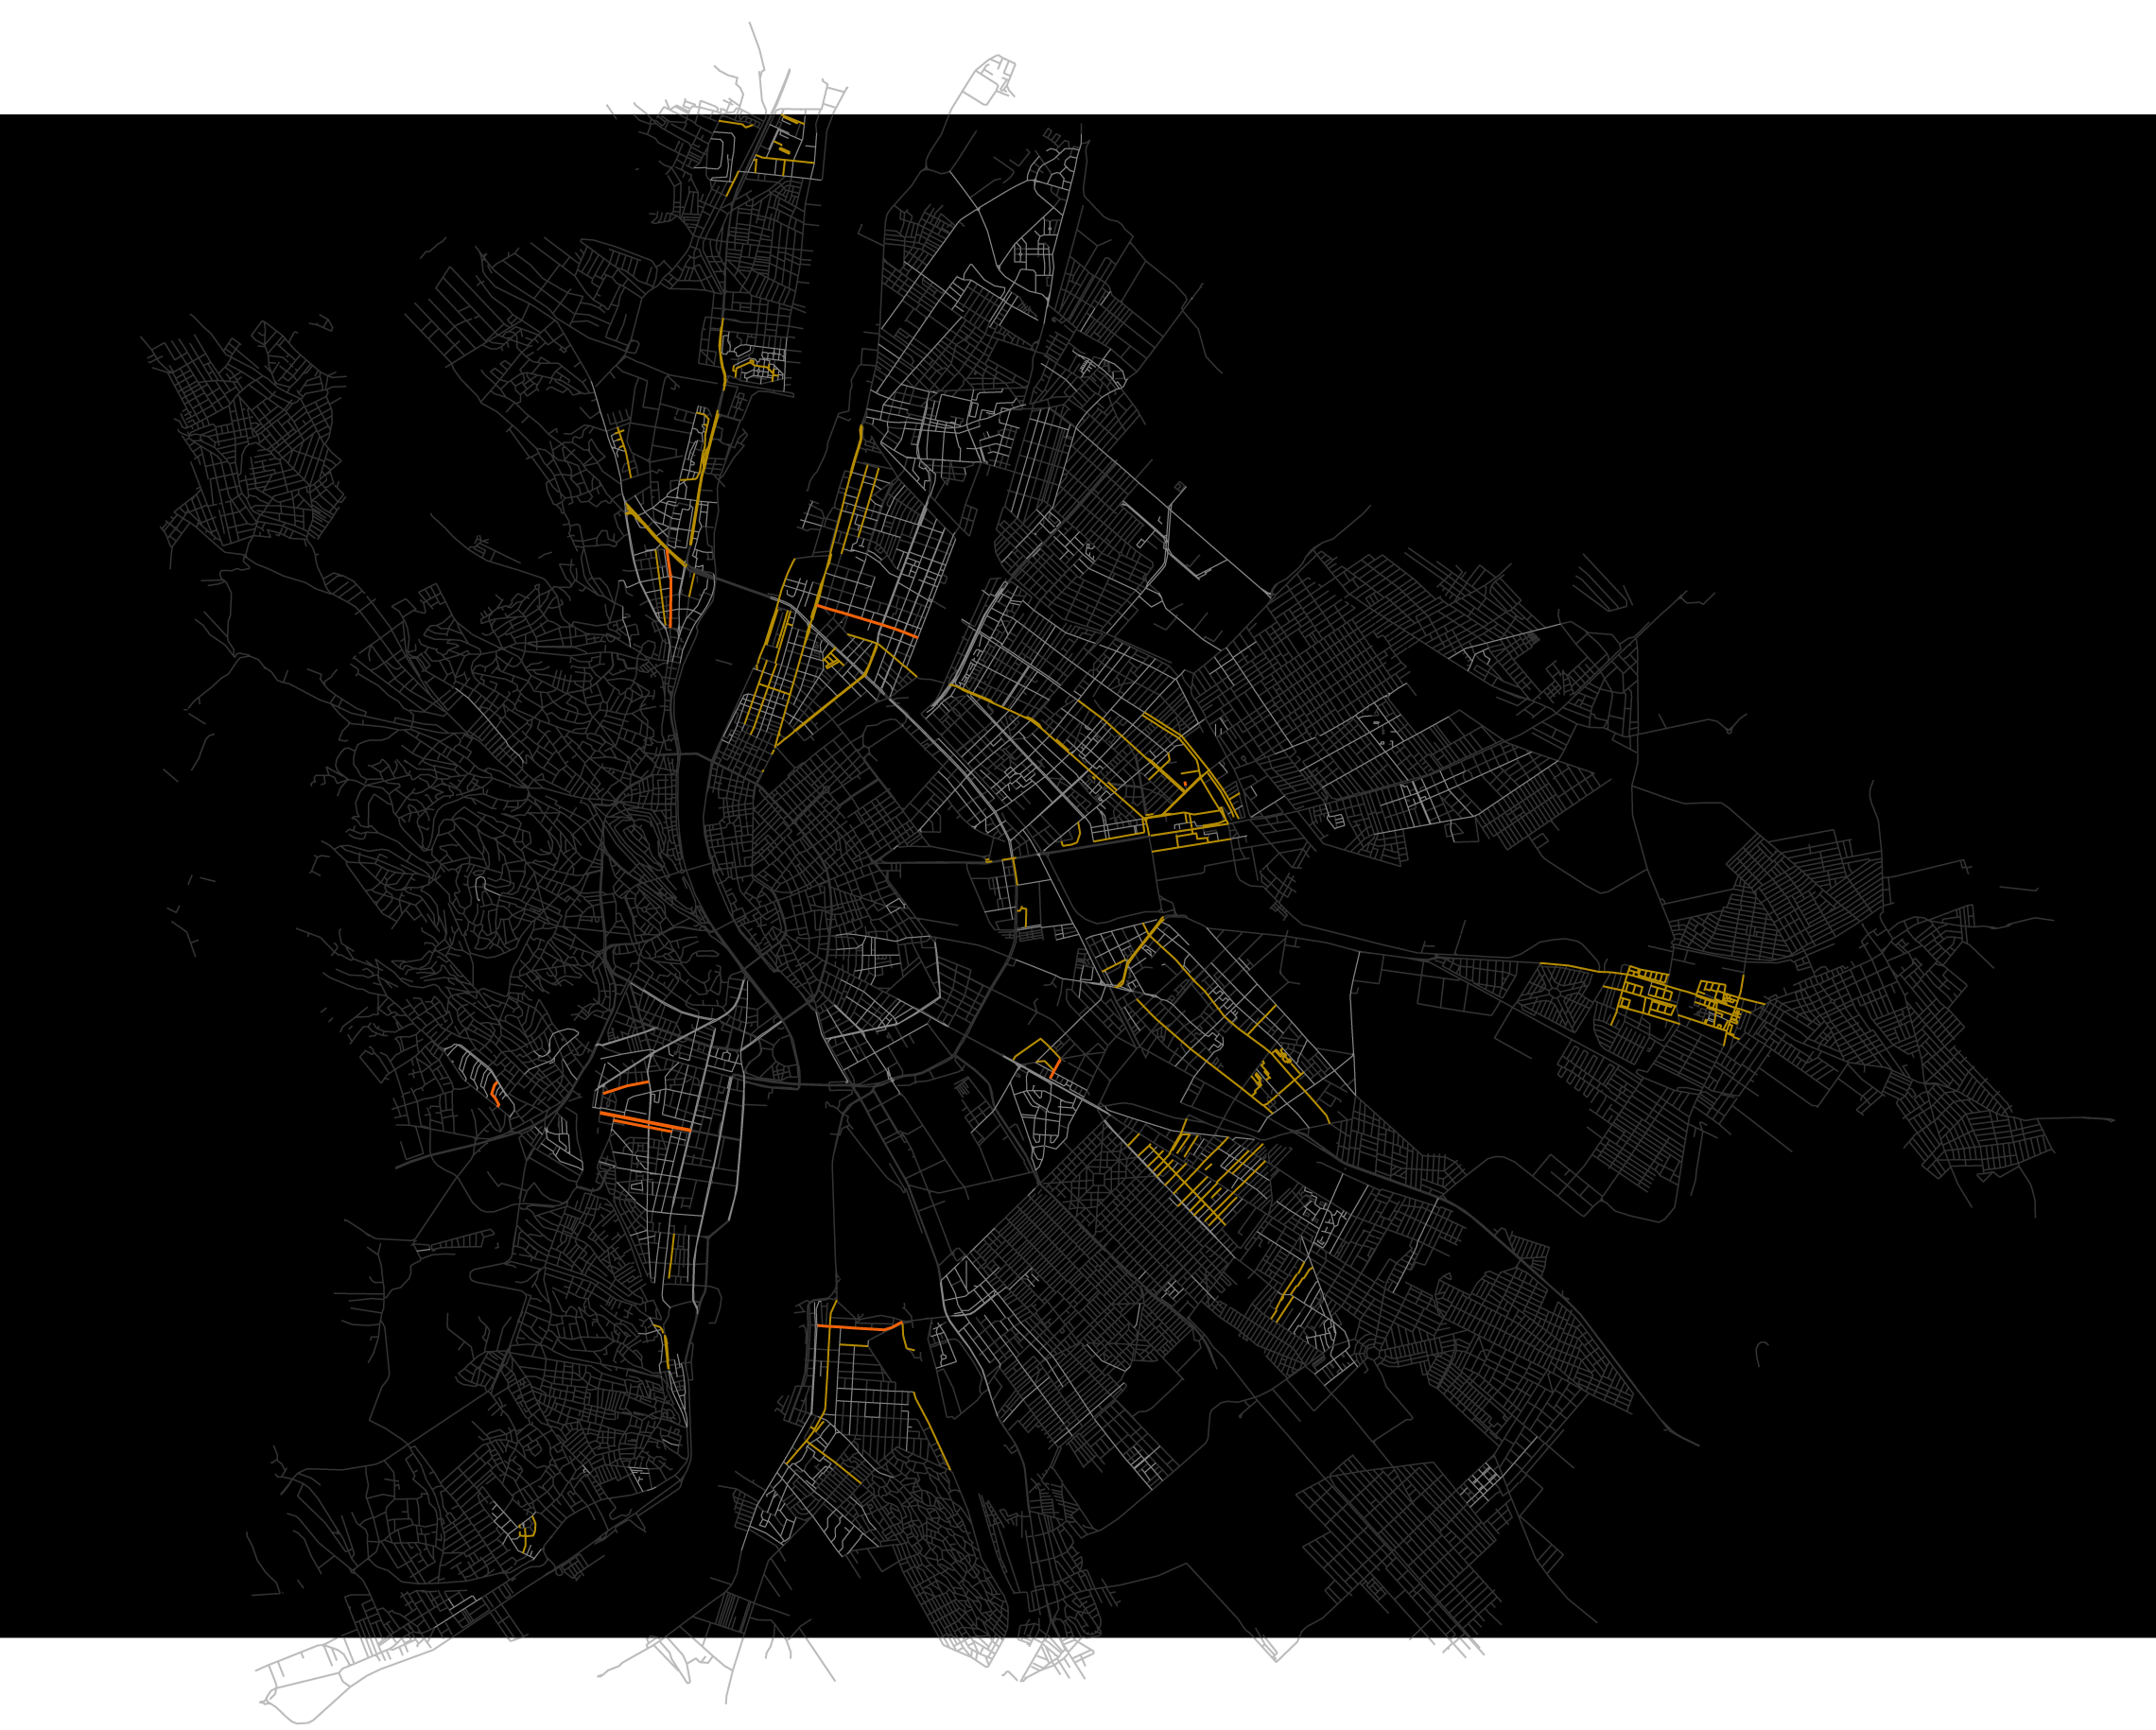
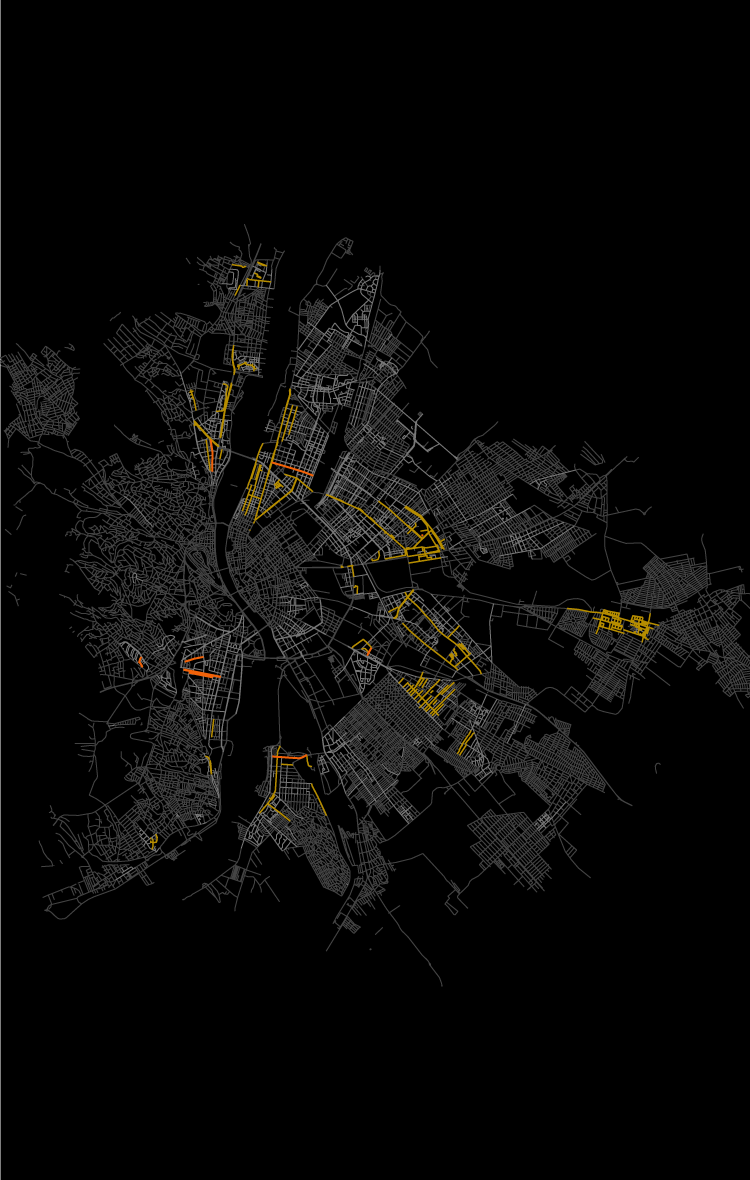
Prices significantly increased everywhere though, but proportions were not generally the same everywhere. In some streets, buying homes in the mid-2000s turned out to be an extremely lucrative deal for investors, but even for private individuals, since prices have tripled, or even quadrupled in a little over a decade. Palotanegyed, the VIII. district neighbourhood on the Western side of Budapest's Grand Boulevard and the similarly located party district of the VII. saw prices drastically explode, however, the demand there is not so much generated by home-owners but investors looking for short-term rentals, but some of the more infamous streets of the VIII. district also managed to increase their prices. The figures show that reconstructions of public spaces greatly increased the value of the nearby real estate, for instance, turning Lövőház street in the II. district into a pedestrian zone quadrupled the prices of homes even in nearby Fény street.
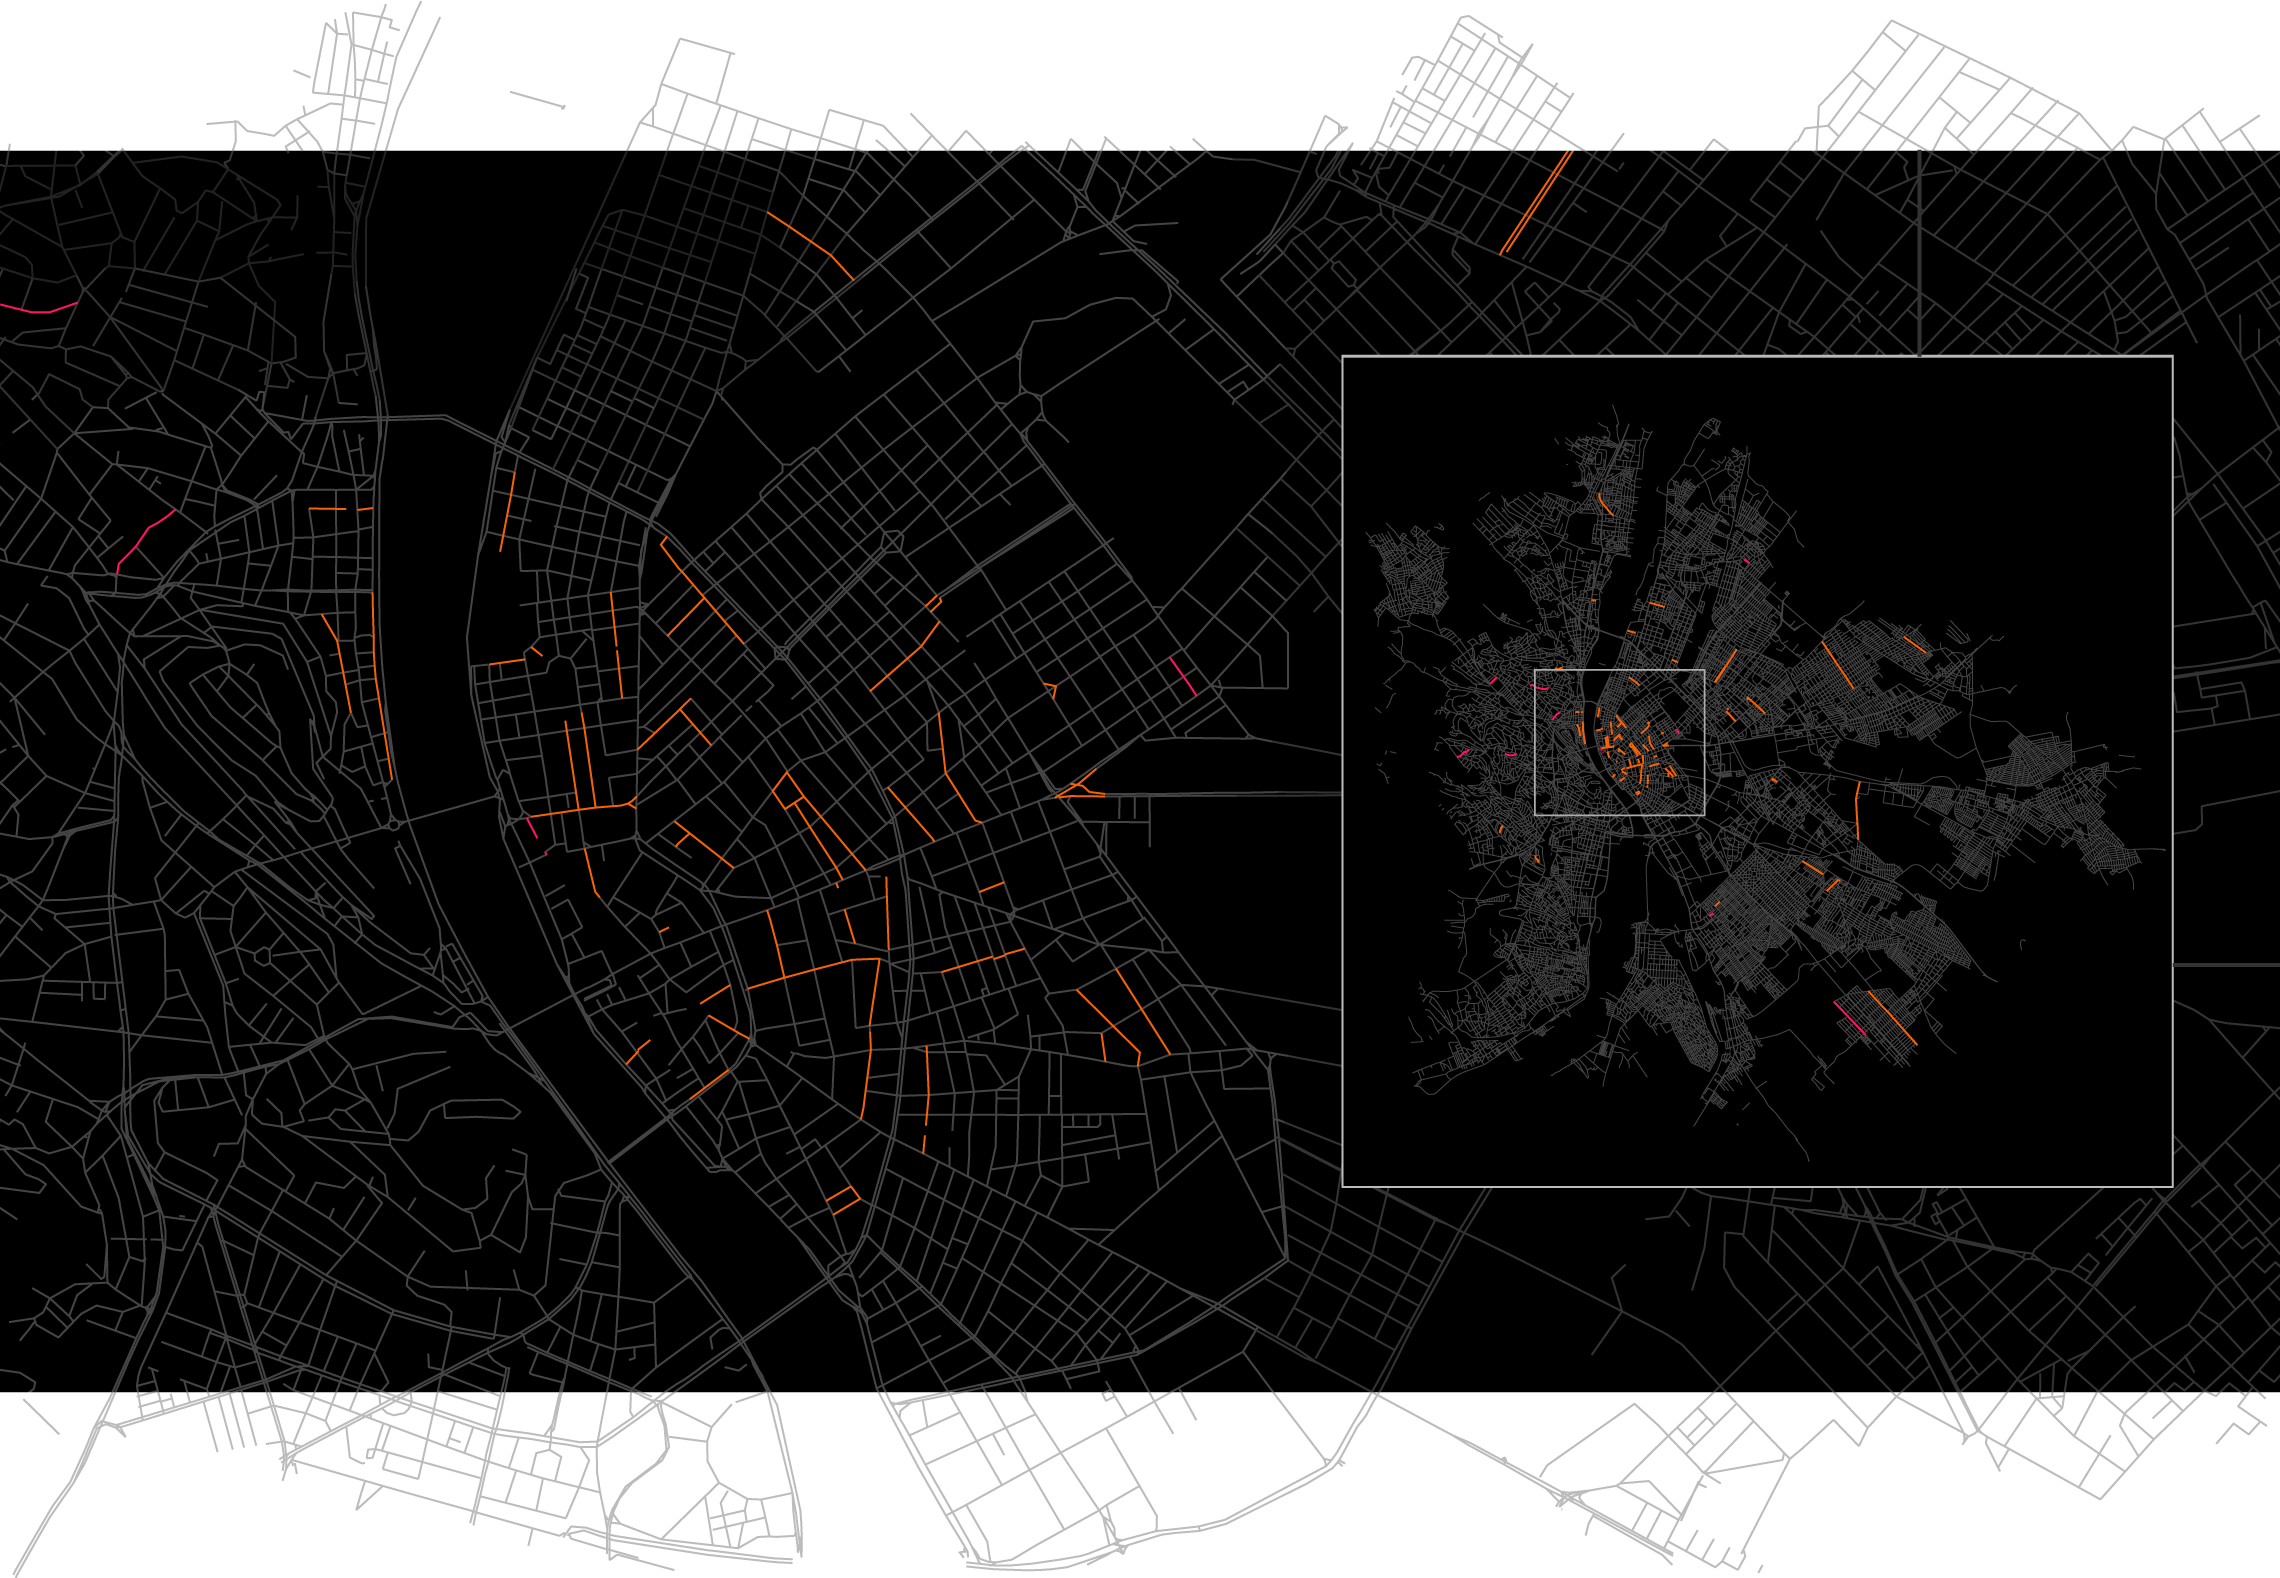
Streets and squares of Budapest with the greatest price hike 2006-2018
Cost per square meter at least tripled
or more then quadrupled.
Taksony u.
Bogár u.
Attila u.
Ganz u.
Fény u.
Balassi Bálint u.
Epres sor
Jókai u.
Matróz u.
Babér u.
Lövölde tér
Vadász u.
Iskola u.
Lovag u.
Vécsey u.
Kerékgyártó u.
Bodor u.
Bekecs u.
Josikai u.
Garibaldi u.
Szinva u.
Riadó u.
Bethlen G. tér
Lázár u.
János u.
Jerney u.
Dalszínház u.
Október 6. u.
Ordas út
Szövetség u.
Bem rkprt.u.
Sólyom u.
Sas utca
Baross tér
Klauzál tér
Osvát u.
József A. u.
Kozma u.
Kaptárkő u.
Klauzál u.
Dorottya u.
Rumbach S. u.
Móricz Zs. u.
Nyár u.
Vőfély u.
Bécsi u.
Sárrét u.
Ferenc u.
Somogyi B. u.
Gyulai P. u.
Szarvas u.
Puskin u.
Karácsony S. u.
Bródy S. u.
Déri M. u.
Dankó u.
Kisfaludy u.
Kecskeméti u.
Szélső u.
Sörház u.
Szigetvár u.
Mária u.
Vámház krt.
Kisfaludy u.
Bakáts tér
Average cost of sq. meter based on sales from 2006 to 2018. Streets where at
least three sales took place in both years.
source: KSH ingatlanadattár
Streets and squares of Budapest with the
greatest price hike 2006-2018
Cost per square meter at least tripled
or more then quadrupled.
Ambrus u.
Taksony u.
Bogár u.
Ganz.
Balassi B.
Fény
Jókai
Lövölde tér
Vadász
Iskola
Garibaldi
Josikai
Szinva
Bethlen tér
Lázár
Dalszínház u.
Október 6.
Szövetség
Bem rkprt.
Sas
Baross tér
Klauzál tér
Osvát
József A.
Klauzál
Dorottya
Rumbach
Nyár
Bécsi
Somogyi B.
Gyulai P.
Puskin
Déri M. u.
Karácsony S.
Bródy S. u.
Dankó
Kecskeméti
Sörház
Mária
Vámház krt.
Kisfaludy
Bakáts tér
Attila
Epres sor
Babér
Kerékgyártó
Riadó
Bekecs
János
Jerney
Ordas út
Sólyom u.
Kozma
Kaptárkő
Móricz Zs.
Vőfély
Ferenc
Szarvas
Kisfaludy
Szélső
Average cost of sq. meter based on sales from
2006 to 2018. Streets where at least three
sales took place in both years.
source: KSH ingatlanadattár
But most streets where current prices are four times as much as they were in 2006 are located in the outer districts of Budapest, but that is not a surprise - the average price hike there was the highest in Hungary during the past decade. With that said, homes there are still cheaper than in the city centre.
The prices of socialist-era prefabricated homes also went up during this period, Budapest shows this trend nicely. Prefabs were traditionally cheaper than brick-walled housing, but the difference seems to be slowly melting away, by last summer, that rule of thumb became more-or-less obsolete.
Price increase of prefabs 2006-2018
Property prices has at least doubled,
or more than tripled in large-panel prefabricated building blocks
Petneházy utca
Szőlő utca
Frankó utca
Somfa köz
Regős utca
Etele út
Ady Endre út
Average cost of sq. meter based on sales from 2006 to 2018. Streets where at
least three sales took place in both years.
source: KSH ingatlanadattár
Price increase of prefabs 2006-2018
Property prices has at least doubled or more than tripled
in large-panel prefabricated building blocks
Szőlő utca
Petneházy utca
Frankó utca
Regős utca
Somfa köz
Etele út
Ady Endre út
Average cost of sq. meter based on sales from
2006 to 2018. Streets where at least three
sales took place in both years.
source: KSH ingatlanadattár
Prefabs' average rate of price growth exceeded that of traditional brick-walled homes, as you could see, flats in many prefab neighbourhoods have tripled their prices by 2018 since 2006. Prefab homes located near green areas were the most popular: owners of II., III., XI., and XXII. district flats have made huge profits, but the XIX. district was not far behind either. Analysts say that the reason behind the phenomenon is that many buyers yearning for brick-walled homes were simply priced out from them, driving the demand for prefab homes.
Support the independent media!
The English section of Index is financed from donations.
Kövesse az Indexet Facebookon is!
Követem!